Showing posts with label bank profitability. Show all posts

Thursday, February 27, 2025

Beyond Altruism: Turning Financial Wellness into a Bank Profit Center

Discover how financial institutions can transform financial wellness from a cost center to a profit center. Learn strategies for implementing successful Financial Wellness Centers (FWCs).

Introduction

In an era where financial security is increasingly elusive, many banks tout 'financial literacy' as a core mission. But is it truly making a difference? The stark reality: 78% of Americans live paycheck to paycheck. It's time to move beyond well-intentioned programs and create a sustainable, profitable model for financial wellness. Let's explore how banks can build Financial Wellness Centers (FWCs) that not only empower customers but also drive significant revenue.


1. The Stark Reality: Financial Wellness in Crisis

  • The shift from defined benefit pensions has thrust individuals into a complex financial landscape, where many are struggling. Studies reveal alarming statistics: a majority of Americans are financially vulnerable, and retirement savings are inadequate. This isn't just a societal issue; it's an opportunity to differentiate your financial institution.
  • Fourteen percent of people who feel their banks help them with financial wellness.
  • Financial institutions have a responsibility to address this gap, but altruism alone is not a sustainable solution.

2. The Problem: Financial Literacy as a Cost Center

  • Currently, financial wellness initiatives often operate as cost centers, driven by compliance or community relations. This approach fails to align with the core business objectives of profitability and growth.
  • Anne Shutt's (Midwestern Securities) insights at a recent conference highlight the disconnect: customers aren't feeling supported by their banks' financial wellness efforts.
  • The current model serves some constituencies at the expense of others.

3. The Solution: Transforming Financial Wellness into a Profit Center 

  • Introducing the Financial Wellness Center (FWC): A New Model for Success.
    • Treat it like a branch: Dedicated personnel, clear objectives, and measurable results.
    • Staff with financial coaches and support staff, not just traditional bankers.
    • Integrate financial wellness into the customer onboarding process. Use the Know Your Customer process to also understand the customer's financial wellness. Offer a financial wellness opt in program.
    • Implement a small quarterly fee for the FWC program. (Consider waiving initially to build momentum.)
    • Bring current customers into the FWC using observable data, human judgement, and generative AI.
  • Revenue Streams and Profitability:
    • Account integration: Incorporate FWC client accounts into its revenue stream.
    • Fee-based services: Offer credit score monitoring, bill negotiation, and other value-added services.
    • Increased customer engagement: Higher engagement leads to increased account activity and profitability.
    • Address the low balance issue by recognizing that this is an investment in the customers' future, and that the FWC is a place for them to grow their financial health.
    • The FWC will have less overhead than a physical branch.

4. Measuring Success and Driving Growth

  • Key Performance Indicators (KPIs):
    • Pre-tax profit as a percentage of average deposits (e.g., 50 basis points).
    • Customer adoption of personal financial management tools.
    • Improvements in customer net worth and credit scores.
    • Customer graduation to wealth management services.
  • When customers reach the 'Accumulating Wealth' stage of their financial life, seamlessly transition them to your wealth management division. This creates a natural pipeline for high-value clients. Don't wait for high-value clients to grace your door, build them.

5. The Benefits: A Win-Win for Banks and Customers

  • Enhanced customer loyalty and retention.
  • Increased profitability and revenue diversification.
  • Strengthened community impact and brand reputation.
  • Empowered customers with improved financial well-being.

Call to Action:

Ready to transform your bank's approach to financial wellness? I would welcome a session with your team in how to implement a successful Financial Wellness Center and drive sustainable growth. Share this article with your colleagues and industry peers to spark a vital conversation.


Friday, December 27, 2024

Financial Metrics of Credit Unions vs. Banks

I often hear that credit unions (or mutual banks) don't have to maximize profits because they don't have shareholders.

This is technically correct. Shareholders demand a return in the form of capital appreciation on the stock and the dividends paid per share, also known as total shareholder return (TSR). Credit Unions, however, do have owners that they call members. Members may pay little attention to the increase or decrease in the value of what they own because they are comfortable under the umbrella of NCUA insurance (much like depositors with FDIC insurance). This comfort might not make them salivate in anticipation of their CUs next quarterly Call Report. Members rarely hold CU executives accountable for financial performance.

But financial performance has meaning. Credit Unions primary source of capital is retained earnings. And if they have sub-optimal profits because of a lack of expense or pricing discipline, there is less retained earnings and therefore less capital to support growth or serve as a buffer for hard times. 

In addition, if CUs are inefficient and squander resources deep in the bowels of their infrastructure, there is less for members/depositors, employees, or their communities, i.e., their stakeholders. In this sense, TSR has a different meaning: total stakeholder returns. For example, some credit unions pay special dividends to depositors if they have good earnings and sufficient capital.

This month Robins Financial Credit Union, a $4.6 billion in asset CU in Georgia, paid a $20 million member rebate, representing about $74 per member and 45 basis points of its ROA. The reason they did it: their YTD ROA was 1.31% and their net worth/assets was 16.12%. Combine that with a clean balance sheet (0.41% delinquent loans/total loans) and there were ample resources to return that solid performance to their members. It's their money, right?

But the CUs that don't deliver that performance or have that capital position and strong balance sheet, management teams and trustees are reticent to return that money to members. Or other stakeholders for that matter.

Below is a series of charts that compares and contrasts the financial performance of banks + thrifts and credit unions with between $1 billion and $10 billion in total assets. Banks were controlled for those with less than 20% of their loan portfolio in commercial real estate loans to mitigate the differences in bank vs credit union balance sheets. This yielded only 118 banks because of the commercial loan restriction, versus 319 credit unions. I used medians so a few outsized banks or CUs didn't skew an average. The median-sized bank was $2.1 billion in total assets and the median CU was $2.2 billion. 

Here are the results (courtesy of S&P Capital IQ):


Banks had a 41 basis points year-to-date advantage (1.00% vs .59%) in ROAA although banks pay federal taxes. Apply that to the median CU size of our sample ($2.2B in total assets) and that equates to $9 million. Perhaps that disadvantage is precisely because the measured CUs pay a special dividend to members, although banks' cost of interest-bearing liabilities was 1.21% more than CUs. Perhaps the salary and benefits per FTE is greater at CUs than banks, or their community support costs more. This we can't tell from the above charts. 

CUs will have to reflect on if that is true. 

Is it true that the 82 basis points disadvantage to banks in year-to-date non-interest expense to average assets, which equates to $18 million, is because CUs pay their people more, or provide that much more in community support?

Whether you have shareholders or not, running your business for the benefit of stakeholders should be your guiding star. You are doing stakeholders no favors by running it sub-optimally and wasting resources on inefficiencies deep in the bowels of your organization. Wouldn't it be great to have a full end-of-year bonus pool where you reward your most productive and loyal employees, have the pricing discipline to deliver a special dividend to your most loyal core depositors, or be able to meet some social needs in your community?

Profit performance matters, no matter which stakeholder(s) you favor.


Happy New Year to my readers!


~ Jeff


Note: My firm does two things to help create the culture for more optimal profit performance for financial institutions: 1) Profitability Measurement-we measure the profitability of lines of business and products on an outsourced basis so management teams can measure and maintain accountabilities for profit trends at much more granular levels than their Call Report; and 2) Process Improvement- we dispatch a team to analyze processes, resource and technology utilization and make recommendations for greater efficiencies. This is sometimes tough to do internally due to resource constraints and experiences outside of the organization. Follow the links to learn more or reach out to me. 


Friday, November 04, 2022

Bankers: Can You Create a Culture of Operating Discipline Even if You Have No or Few Shareholders?

Do shareholders give publicly traded financial institutions an edge over their private and non-shareholder owned financial institution brethren?

I posed this question while speaking at a recent conference. The following slides were used to make my case.


            Source: S&P Capital IQ for Banks-Savings Banks and Credit Unions between $1B-$10B in total assets. YTD=June 30, 2022.

Banks-Savings Banks (SBs) between $1B-$10B in total assets have a slight edge in Yield on Loans to the similarly sized CUs, which makes sense because there would be more commercial loans and relatively fewer residential loans than Credit Unions. Credit Unions held an edge in the Cost of Interest-Bearing Liabilities until 2020 when their cost eclipsed that of Banks-SBs. This might speak to the deposit betas being higher in Credit Unions than banks, as CUs would tend to have less core business and municipal accounts. All of this led to a slight edge in Net Interest Margin in Banks-SBs. Eleven basis points YTD to be exact.

Credit Unions, however, have a noticeable edge in Fee Income to Average Assets, 1.14% YTD versus 0.64% for Banks-SBs. Before my bank friends acclaim "aha, credit unions charge more fees than banks!", I will say you would be correct in fact but the context is nuanced. Although it is my experience that CUs do collect a relatively greater amount of deposit fees than Banks, this can be partly attributable to the average balances per account at CUs. They are lower than banks. It is intuitive that they would collect more deposit fees.

This nuance would be totally lost on Rohit Chopra of the CFPB. So naturally CUs are in alignment with Banks-SBs against the CFPB's crusade against "junk fees." 

Back to my point. CUs generate as much if not more revenue off of their balance sheet than banks. So why is their profitability in the form of Return on Average Assets ("ROA") noticeably and consistently inferior to banks? Twenty-seven basis points YTD inferior. Even though they pay no federal corporate income taxes?

Look no further than their expense ratio (non-interest expense / average assets). YTD the Bank-SB expense ratio was 2.27%. CUs was 2.86%. A 59 bps difference! If the median size credit union from the $1B-$10B group I analyzed achieved the bank versus the credit union expense ratio, the CU would make $11.8 million more in profit.

The CU would counter that they are a not for profit, and don't have sharholders as a constituency. Mutual banks would counter with the same. And while true that shareholders are not a constituency for either, I call bullshit on either of them not needing profits. Retained earnings is their least expensive form of capital. In some cases, their only form of capital. And for those uninitiated in balance sheets, retained earnings are generated from profits!

Now, perhaps, the lost $11.8 million is somehow benefiting one of the other three stakeholders: employees, customers, or communities. It wouldn't be benefiting customers in terms of fees or interest rates, as the analysis above shows. And the $11.8 million is from the expense ratio which has nothing to do with rates or fees.

It could be benefitting employees in the form of better compensation, benefits, etc. Or in the form of better technology. But I know of no credit union that pays their employees materially above market wages or has materially better tech than their banking brethren. I don't have the data or CU by CU analysis to make a definitive BS call, but let's say I'm skeptical.

Where I think the excess $11.8 million resides is buried in bureaucracy and infrastructure. They don't have to answer to shareholders, so the discipline of maximizing profitability for the benefit of stakeholders so often enforced by shareholders is not part of their culture. 

And it's a shame. Because if they had that $11.8 million, imagine the tech investments, employee initiatives, core deposit special dividends, or community support they can provide. 

For those that are not shareholder owned or are privately held, implement cultural operating discipline so you have the resources to be relevant, even important to the other stakeholders.


~ Jeff


Sunday, March 27, 2022

Bankers: Just Do It!

"That's all fine and good, but if your bank doesn't do it or the reporting doesn't get to the front line, how can we improve?"

~ Montana Bankers' Association Executive Development Program Student


Sing from the same sheet of music. Row in the same direction. Everyone should be on the same page. 


Do we really want this? 


I'm finishing my annual tour of the West teaching bank profitability as part of various states' Executive Development Programs. Students are typically mid-level and have high potential. As part of that class, we drill down from "top-of-the-house" financial metrics, such as ROA, Net Interest Margin, Efficiency Ratio, to the most granular numbers, such as the ROE hurdle rate of a customer relationship.

Few have access to information at the line of business, product, or relationship level. Branch managers were unaware of their P&L, lenders were unaware of the ROE of their portfolio. And for me... disappointment.

Because if we want everyone from the Board Room to the customer contact person to "sing from the same sheet of music", why on earth do we have executive incentives tied to Return on Equity but hold lenders accountable for loan volume? It is inconsistent. In fact, it incents lenders to work against your ROE, promoting larger, thinly priced deals without regard for structure, duration, or capital needed to support the loan. It is the antithesis of "rowing in the same direction."

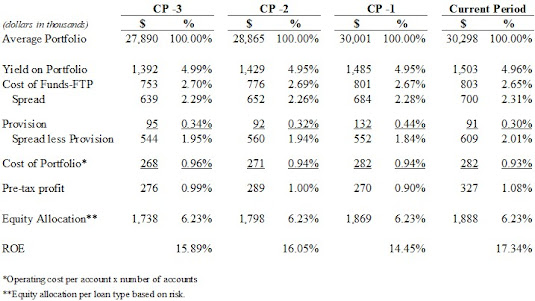
Imagine, holding lenders accountable for the continuous pre-tax profit and ROE improvement of their loan book, like the table below.


We either: don't do this (most likely), or do this but allow naysayers to poke holes into the art part of management reporting because they don't look particularly good (lack of leadership), or do this and keep it bottled up in the executive suite (nice to know). I realize my firm has self-interest in the first reason because we do this on an outsourced basis for financial institutions. But that aside, everyone should do this! Imagine the behavioral changes this would foster. Behaviors we now try to control with incentive schemes to offset the unintended negative consequences of incenting on volume. 

I recently wrote about Branch Profitability in Practice, so I won't belabor the point on holding branches accountable for continuous profit improvement.  A bank CEO recently asked me if I thought using branch pre-tax profit rankings amongst all of his bank's branches would be an incentive that is consistent with the bank's strategy. Knowing the CEO's passion about being a superior financial performer, of course it would! His top quartile branches in pre-tax profit should receive a greater bonus pool than his bottom quartile. Again, this bank has the luxury to do this, because they measure profitability of their branches. Those that don't use deposit growth, or net new accounts, or some other metric that's easy to get out of their core but may not be consistent with strategy.

Don't leave support centers in the lurch. If you incent your Compliance Department with no audit exceptions, should it be a surprise that it was next to impossible to get online account opening off of the ground when branchless banks have been doing it for a decade? How about incenting them on how quickly audit exceptions are cured? Think of the cultural change.

There are ways to incent other support centers to row in the same direction as strategy. If the executive team is incented on being efficient compared to peer, wouldn't it be consistent to incent the Loan Servicing Department on their operating expense to average loans? That combined with loans serviced per Loan Servicing FTE would make for a transparent incentive that has that Department singing from the same sheet of music as the overall bank.

I think I've thrown enough management bromides at you.

We continue to talk about implementing the solutions to serve our most valuable customers without having any idea who the most valuable customers are. Imagine if the lender had 50 relationships, 10 over his/her ROE hurdle rate (white glove service), 20 hovering at or under the hurdle rate (take action to get them over it), and 20 are far under the hurdle rate (efficiently serve them). But we don't do it.

Imagine if the branch gave the best service to those customers most valuable to that branch. If only they knew who they were. Maybe we should.

Instead of accepting how we currently do it, perhaps we should do it like it should be done. In a changing financial world full of shiny objects and the need for focus, we should know the profit trend of the residential lending department, our commercial lenders, our branches, and our most valuable customers. How else would we know they are the most profitable?

Stop accepting incentives not consistent with strategy. Don't leave profitability behind in your data journey. 

Just Do It!  


~ Jeff


Saturday, July 03, 2021

Bank Customer Lifetime Value

Who are your target customers? Answer: XYZ
Why are they your target customers? Answer: They are our most profitable customers.

May I see your profitability reports that show this? Answer: *crickets*

Is "most profitable" the right answer? Aside from my skepticism that the financial institution actually calculates who their most profitable customers are. But in doing profitability reporting for decades, I feel comfortable saying that most commercial-focused financial institutions' most profitable customers are commercial real estate investors. Not small mom-and-pop real estate investors. The ones with the big balances.

Targeting them would likely yield a very profitable bank. But would it be a valuable bank? It is highly competitive in the large commercial real estate space. Not only are there community financial institutions chasing that business, but large banks, conduits, insurance companies, loan brokers, etc. The competition is, well, not very "blue ocean" like (compete where the competition isn't). 

I'm not down on commercial real estate. Any balanced balance sheet should have its fair share of investor CRE to boost profits. But to boost value, I ask again, who are your target customers?

In comes what experts deem "lifetime value" (LTV). Can we categorize, and generalize, customer segments to predict what segment delivers the greatest LTV? Because if we consider spot profitability, we should target CRE. It is likely the reason why so many bank balance sheets have concentrations in this product. 

Let's take a doppelganger customer segment: Recent college graduates with high earnings potential. We're not talking philosophy majors here. I already have enough of them fumbling my coffee order. I'm talking the docs, engineers, accountants, cyber security, et al. The customers that SoFi targeted out of the gate.

See the table below for our recent engineering major grad, who is working as a junior engineer for an environmental engineering firm. Four years after becoming our bank's customer, he/she breaks out on his/her own. 


As you can see, the Total LTV in the top table shows a pretty profitable customer, and likely customer segment. But if you look at the spot profitability in Year 1 of the bottom table, our doppelganger customer doesn't look so attractive. Profits actually decrease in years two and three. THIS is why estimating LTV of identifiable customer segments is so important to strategic decision making in financial institutions. Not only must we calculate LTV by segment, but we must also compare to external data to ensure there are enough of these "households" in our markets so we can build critical mass.

There are business models that span the country for their targeted customer segments. In addition to the already mentioned SoFi, Live Oak Bank comes to mind. They started as an SBA shop focused on business segments that were recession proof, like dentists and veterinarians. And searched the entire country for them.

Most of us are geographic focused. But that doesn't mean we shouldn't build our infrastructure: the people, technology, and physical locations, to differentiate ourselves with those customer segments that deliver superior LTV and are in abundant supply in the markets we choose to serve.

Do you calculate LTV?

~ Jeff


And don't forget my book: Squared Away-How Can Bankers Succeed as Economic First Responders

Ten percent of author royalties go to K9sForWarriors.org, who work to bring down the suicide rate among our veterans. 

Kindle

Paperback

Hardcover

Thank you!


Thursday, January 14, 2021

The Death of the Community Bank

In June of 2008 I gave a speech titled "The Death of the Community Bank" and in that speech I made predictions. Recently I was cleaning out my files and I ran into the hard copy slide deck that accompanied the speech. 

If I ignore where I was wrong then I am as guilty of willy-nilly prognostications that I sometimes think industry pundits engage in. So, below is a list of predictions I made and if I was right or wrong, or somewhere in between.


Prediction: The General Bank will become extinct. Much like the General Store fell victim to the supermarket and the lumber yard fell victim to Home Depot, I predicted the community bank that did not pick targeted customer niches or develop product expertise will meet it's doom. The anecdote I used was how the Stephen's Island Wren was rendered extinct by a lightkeeper's house cat. That might be an exaggeration, as many feral cats feasted on the flightless bird as well. Much like competitors nip at community banks' customers. 

Result: Mixed. A mid-2020 survey performed by Cornerstone Advisors showed that 51% of retail customers that opened a new bank account within the last three months did so at a large, national bank. Eighteen percent of that group opened an account at a digital bank. Two percent opened an account at a community bank. When I made that speech in 2008, there were approximately 8,500 FDIC-insured financial institutions and today that is around 5,000, a 40% decline. However, last year's top 5 total return to shareholders post had two traditional community banks on that august list. So there are community banks that bring discernable value to their shareholders and other constituencies. They can have the operating discipline and service to their constituencies to earn their right to remain independent. And I had ING Direct as an example of who might be the lightkeeper's cat to the community bank. A bank that was purchased and is now, well, extinct.


Prediction: Community Banks with < $10 billion in total assets will continue to lose market share. Here was my chart to support the prediction...


It was a pretty alarming slide. 

Result: I was right. I ran the numbers again. Banks and savings banks with greater than $10 billion in total assets control 86% of all FDIC-insured assets and 85% of deposits for the most recent quarter. The days of getting in the ring and slugging it out for market share with other community banks are done. Strategies cannot ignore big banks any longer.


Prediction: Banks with < $500 million in total assets must have superior net interest margins (NIMs) to deliver financial performance. Here is the slide that accompanied the prediction...


Result: Mixed. Banks with less than $500 million in total assets delivered a 3.82% NIM at the median for 2019, while banks above that size was 3.67%. So smaller institutions continue to enjoy a NIM advantage, but not to the extent they did in 2007. And the ROA for <$500MM banks was 1.08% versus 1.22% for the rest in 2019. I used 2019 because of the NIM compression caused by PPP loans and the outsized impact that had on smaller institutions. And I did not filter for Sub S banks, so the ROA difference was probably greater. Having said that, the ROA difference was only 14 basis points. With a narrow advantage on NIM, size is a factor to drive down costs to elevate the performance of smaller banks to that of larger banks.


Prediction: Community banks must solve for the profitability of fee-based lines of business to generate superior results. Here is the slide I used to support the contention...


Result: Mixed. If I put a column in the above chart for third quarter 2019 fee based products profit contribution was -6%. This is from my firm's profitability outsourcing service, which is mostly community banks. In a low rate environment, deposits are less valuable and therefore less profitable. In terms of fees, community banks have not solved for making this a contributing element to their profit picture, yet they remain profitable. Imagine if they did operate fee-based lines of business profitably. That would be an ROA/ROE accelerator. 


Prediction: Senior management will migrate to being strategists, coaches, and leaders rather than tacticians. Here is the slide I used on how leadership should spend their time courtesy of The Breakthrough Company by Keith McFarland.


Result: I was wrong. Although I do not have statistics, only observation. I often hear the "day job" comment regarding strategy execution. In my view, senior managers spend their time more like the first line supervisors in the slide above rather than how the then CEO of Chico's suggest they should spend their time. Could this be a factor in how slow we've moved in adapting to customer needs? Are we spending more time solving for tactical issues rather than moving us closer to our aspirational future?

How do you spend your time?


But the big mea culpa is in the title of this post. As I write, community bankers across the country are helping struggling small businesses with PPP loans, much like they did in the spring to quickly distribute this critically needed funding jolt. In the words of FDIC Chair Jelena McWilliams, community banks were the economic first responders during the pandemic. So in terms of the Death of the Community Bank, I WAS WRONG.


And thankfully so. Let's work together to keep me wrong.


~ Jeff


Wednesday, September 26, 2018

For Financial Institutions, What Drives Value?

Not all financial institutions are publicly traded. But there are enough of them to help those that do not trade to measure what metrics drive the value of their franchise. 

So what metrics drive value? Umrai Gill, Managing Director of Performance Trust in Chicago presented his findings to the Financial Managers Society at their East Coast Regional Conference this month. Some results were surprising.

He first cited a survey performed by PT, asking their clients "what are the generally accepted drivers of institutional value?" Without identifying ranking or more details about their survey, the preponderance of responses were as follows, in no particular order: loan-to-deposit ratio, investment portfolio size, net interest margin, efficiency ratio, return on average assets (ROAA), return on average tangible equity (ROATE), capitalization, and asset size. 

Some were not very interesting to me, such as investment portfolio size, which might have been influenced by PT's specialty. Others might have been too investment community-like, such as ROATE, which doesn't count high premiums bank buyers pay for bank sellers that results in goodwill on the buyers' books, which is deducted from their regulatory capital. But others struck my curiosity to see if there were correlations between the metric and market valuations. 

And I thought I would share with my readers.The charts in the slides below was PT's analysis of data from S&P Global Market Intelligence based on June 30, 2018 financial information using market data from 08/17/18.

First, the metrics that showed correlation to price to tangible book values. Not surprising, in my opinion.

Asset Size


Efficiency Ratio


Profitability / ROAA


Next, the ratio that did not show a correlation to price to tangible book multiples, at least not over 3.5%. I was a little surprised at this one.


Net Interest Margin


Lastly, and most interesting from my point of view, were ratios that showed mixed results. In other words, they showed positive correlation to price-to-tangible book ratios, up to a point. After which, they showed a correlation, but not what bankers would hope for.


Tangible Common Equity / Tangible Assets


Loan-to-Deposit Ratio


The highest market multiples were afforded to banks with a 70%-80% loan to deposit ratio. Now that may be related to size of institution, as the very largest, JPMorgan Chase (67% loan/deposit ratio) and Wells Fargo (76%) tend to have lower ratios. But there is likely something to the fact that a bank that still has strong liquidity as represented by a relatively lower loan-to-deposit ratio in a good economy has room to improve earnings by growing loans faster than deposits. While the less liquid must price up their deposits to get funding.

And capital, well, I refer you to a prior post where I clearly stated there was such a thing as too much capital. Investors will not pay a premium for hoarded capital. Performance Trust's research puts that sweet spot in the 9%-10% tangible common equity / tangible assets range. Enough capital to grow and/or absorb recessionary losses without selling off assets at a discount to bolster capital during hard times.

Where are your sweet spots?


~ Jeff


Monday, December 04, 2017

Checking Analysis: The Betamax of Bank Products

Don't think about how it is. Think about how it should be.

Now apply this philosophy to business checking. If we did, would we continue to offer Analysis Checking or some variation of it? 

Yet we do. Even though the Dodd-Frank Act eliminated Reg Q, that pesky reg that did not allow banks to pay interest on business demand deposits. Because of Reg Q, in place for over 80 years, banks created Business Analysis Checking, where a business earns credits to offset fees based on their balances. See a Union Bank of Richmond, VA description of a typical Business Analysis Checking account. 

But it doesn't stop at the checking account. Businesses want to earn interest on their excess funds. So they determine how much to leave in their non-interest bearing, analysis checking, and then sweep the excess to some interest bearing vehicle, such as a money market account, or, gasp, a repo because prior to the financial crisis deposit insurance only extended to the first $100,000 of a business's deposits. Repo's are generally collateralized. So there is all sorts of complications going on to run a checking account and to pay business interest on guaranteed funds.

Does it have to be?

I say no. And because highlighting a problem without proposing a solution is whining, I propose the JFB Alternative to Business Checking Analysis. Or the JFB Business Banking Cash Maximizer. 

My firm measures product profitability on an outsourced basis for dozens of community financial institutions. As a result of this line of business, we are able to see product spreads, fees, and costs. And by costs, we measure the average organizational resources to originate and maintain a business checking account. The average for all of the banks in our profitability universe was $590.50 in operating expense per year.

We also calculate the spread using coterminous funds transfer pricing (FTP), and the actual fees assessed to those accounts. That combination of spread and fees was 2.14% of balances during the second quarter 2017.

Knowing the operating cost per account, and revenue generated as a percent of balances, you can calculate the average balance needed to be maintained to cover the account's costs. Said another way, it's breakeven balance. See the table.


Based on the average operating cost per account, and revenue as a percent of balances, the average account holder would need to maintain an average balance of $27,593.46 to cover the bank's costs.

Hold on though. Nobody is average, right? Our universe of business checking customers vary on their account utilization. Some are high cash businesses, that frequently make a night drop of deposits requiring our tellers to validate and make the deposits. Others are no cash, and use our RDC machines to deposit a relatively small amount of checks.

You see that I divided account types into quintiles to make this distinction. What this requires is a way that your core system can put a code to determine which quintile each account belongs. I believe this can be accomplished by the oft-cited with few practical installations... Artificial Intelligence, or AI.

Your core tracks transaction types per account. Each transaction type uses a certain amount of bank resources. You don't have to come up with a dollar amount, highly contrived by the way, of each transaction. Such as an ACH costs the bank $18.65. But what you can do is say that in terms of resource utilization, an ACH takes 2x the resources used by an RDC deposit. So, for example, an ACH might have an 8 on a scale of 1-10 for resource utilization, and an RDC might be a 4.

By scoring transactions by resources used, you can then divide your business checking customers into the above quintiles, and assign a cost per account accordingly. The aggregate dollars it takes your bank to originate and maintain business checking accounts remains the same, at $2.975 million. But the cost per account is broken up by resource utilization.

So the one-person law firm that RDC deposits 20 checks per month might be designated a Low Activity quintile, and be assessed a $354.30 operating cost. While the cash-driven marijuana shop that drops off loads of cash over the teller line each day, would be rightly assessed $826.70.

Now you have the means to determine the minimum average balance to cover costs. Anything over that amount, is paid interest. No sweep. No analysis, at least not in the past use of the word. No multiple statements. And no human intervention.

Just an easy account to explain to your client. And an easy one for your client to manage.

Let's send Business Checking Analysis to the Betamax pile of history.

Are any of my readers doing this?


~ Jeff


Sunday, September 10, 2017

Bankers: Five Ways to Use Profitability Data to Move You Forward

Accountability is a dirty word. It evokes images of finger wagging, stern looks, and sheepish floor staring. I'm sure at one point of the word's evolution it wasn't this way. Words and phrases earn their reputation by those that use and receive them. In banking, it is what we made it to be.

On a recent Pennsylvania Institute of CPA podcast, Bob Kafafian from my firm was asked how to use management information. Bob's response resulted in a follow-up question by a Midwest banker friend of mine. 

And since I am scheduled to speak about it at a Financial Managers Society breakfast tomorrow, I'll answer it.

Here are my ideas on how to use Management Information to create a positive accountability culture.

1. Hold branch managers accountable for revenue growth. Revenue growth equals deposit spread (coterminous using funds transfer pricing, or FTP), loan spread less provision (for loans that the branch is responsible for generating), and fee income. Imagine if Wells Fargo branch managers were accountable for this, instead of number of accounts per customer. Fake accounts with little or no balance generate little or no spread. But draws operating expenses from support centers. Imagine if your branch managers were accountable for this instead of deposit dollar growth. Would you be getting that desperate phone call asking for a rate exception to keep the money at the bank?

2.  Hold lenders accountable for their portfolio ROE. You read it right. That's an "E", not an "A".
Lending is a risk business, and aside from the provision expense, and net-charge off rate, those loans require equity to support them. If you allocate equity by product based on your institution's risk experience, then you know how much equity your institution requires. It should be part of your capital plan. Drill that down to the loan level, you can create ROE hurdles when lenders price loans, and measure their pre-tax ROE on their entire portfolio using the coterminous spread, less provision expense, less operating expense per loan type, to calculate the lenders' actual ROE for their portfolio. Imagine!

3. Hold support centers accountable for a decreasing relative cost per balance sheet category. If measuring a deposit operations department, then the operating expense from deposit operations as a
percent of deposit balances should decline long-term in a growing institution. It is the very definition of economies of scale. Notice I say long-term, because you don't want to defer investment in personnel or technology in fear of causing an upward blip in your trend. That's managing by budget that has caused executives to reduce innovation so they can make their budget.

4. Rank. Nothing should be more motivating than ranking branches, lenders, and support managers in achieving their goals as measured by Management Information than seeing where they rank among their peers. Including a ranking report of your twenty branches by revenue growth, and profitability,  in a sales meeting should put smiles on the faces of those at the top, and a look of determination on the faces of those wanting to get there.

5. Reward. Incentivize your personnel for achievement. Let's turn that frown upside down when we talk of accountability. Deposit Operations costing 16 basis points of deposits three years ago, and 12 basis points today, is an achievement that should be recognized by the entire institution. The same for ROE improvement for lenders, or pre-tax profit improvement by branch managers. Let's not foster a culture of fear, recrimination, and public floggings. Let's raise up our achievers!


I frequently speak of financial institutions' over-investment in under performing branches. Those investments of our precious operating expense dollars could be used in more promising areas. Instead, we limit resources to the very things that could lead us to a more sustainable future. Using profitability information to incentivize the right behavior will create a culture of achievement, and help us make more efficient decisions to better serve customers, reward employees, and improve performance. 

How do you use Management Information to run your bank?

~ Jeff


Note: This is my personal blog and I mostly refrain from direct sales pitches. But since I firmly believe 1) every financial institution should do this, and 2) few have the resources to do this, I offer this...

My firm, The Kafafian Group, does profitability reporting on an outsourced basis because we recognize the challenge community financial institutions face in building their own model, and running it quarter after quarter. If interested, call Gregg Wagner, our practice leader, at 973-299-0200 x114 or reach him at gwagner@kafafiangroup.com. 


Saturday, November 23, 2013

Bankers: Are We Accountable?

Twenty years ago there were 14,000 FDIC-insured financial institutions. Today that number is cut in half. The reasons are many. And yes, some are beyond our control such as population mobility, technology, and the need for some scale to invest enough to remain relevant. But, as my one-time Division Officer, Lieutenant Proper, once told me: "Be careful pointing your finger, because the other three are pointing at you."

I recently made a presentation to staffers and advisers to the Pacific Coast Banking School (PCBS) regarding what I would change in the curriculum. My theme was that if we keep teaching bankers the same things, and expect different results (i.e. not cutting our industry by half), then we are insane. I don't think I'll be invited back.

Banking is an industry that is particularly susceptible to external forces such as interest rates, business and consumer confidence, and the economy (both local and national). So if things go wrong, there is plausible deniability as to what or who is responsible. Strange that when things go right, it's difficult to find plausible deniers. But I digress.

Because of the external forces that impact results, it is typical to gravitate to holding ourselves accountable to things under our direct control... i.e. our expense budget. Volumes and balances... not my fault, there's no loan demand. Margins... not my fault, the irrational competitor down the street is being too aggressive. Profits in fee based businesses... not my fault, soft insurance market.

I find this when analyzing client profitability reports. Nobody wants to absorb the costs of support centers, such as HR, IT, and Marketing, or overhead centers such as Finance or Executive. Hold them accountable for their direct profits, because that is what they can control. It reminds me of Louisiana Senator Russell Long's quip in the 1950's... "don't tax you, don't tax me, tax that fella behind the tree." I suppose if nobody finds value in support centers to the point they agree to pay for it, we should eliminate those costs.

I think the answer to move our industry forward by establishing an accountability culture is to identify a few, transparent metrics that are consistent with strategy that hold managers accountable for continuous improvement. To overcome macro-economic factors, use trends and comparatives. For example, if you hold branch managers accountable to continuously improve their deposit spreads, compare them to the average and top quartile deposit spreads of all of your branches. The result of this accountability should be continuous improvement in your bank's cost of funds compared to peers. But instead of managing at the "top of the house" (i.e. bank's total cost of funds), we burrow down to the managers responsible for generating funding.

But since there is some art and science that goes into developing management information to establish accountability at the ground level, those managers that don't shine will frequently lob darts onto the results. But bankers that are committed to identifying and executing on a strategy that differentiates them from the remaining 7,000 FIs, should identify the metrics that correlate to successful strategy execution. 

And when managers challenge the message to dilute their accountability, senior leaders must be exactly that...

Leaders.


~ Jeff


Sunday, January 13, 2013

Should Banks Jettison Unprofitable Customers?

No.

I will tell you why in a moment, but first why I thought of this question.

Alan Weiss of Summit Consulting penned a book called The Consulting Bible (see my bookshelf if interested in the book). In it, Weiss suggests you jettison the lower end of your client list when you win new clients. His reasons:

  • The client is no longer profitable.
  • You are bored with the work.
  • The client is troublesome.
  • The work is unpleasant.
Financial institutions rarely go through such an exercise. In fact, I am currently preparing for a meeting with a client to discuss what to do about unprofitable branches. It has always been challenging to advise clients to reduce rather than to add. But to add value to customer interactions in banking, we have to dedicate time to making our customers situation better, in some way. Continuing to rely on having a nearby branch or a mobile app to add value will solidify our position as a commodity, in my opinion.

Instead, what we can offer customers is hassle free banking, improved financial condition, and peace of mind. To do that, we need talented employees with time. Time cannot be expanded. Giving 110% of your time only makes sense on a t-shirt.

But unlike consulting, financial institutions make most of their revenue on the spread. If an unprofitable customer keeps $10,000 in deposit balances with you and you can re-deploy that money at a 3% spread, then you generate $300 in revenue on very little marginal cost. Letting that customer go to a competitor will not reduce employee or occupancy expense. In fact, you would experience very little cost reduction (FDIC insurance and possibly a small data processing savings). 

But what you can do is push customer service to the appropriate level based on the value of the customer to you. Keep your most talented employees reserved for your most profitable and strategically important customers. Because those customers have the greatest potential to appreciate the value your FI brings to their situation. Growing high value customers while properly serving commodity customers is critical to improving your FI's relevance and breaking the commodity cycle.

Any stories out there about identifying and serving high value customers appropriately?

~ Jeff

Friday, October 05, 2012

Banking's Curious Lack of Profits in Fee-based Businesses

Remember the good old days when bankers talked big about their fee income prowess? And bank stock analysts issued glowing reports about revenue diversification, and the banks that get “it”. As a side note, if anybody knows what “it” is, please let me know. Because in the fee based business game, “it” appears to be wasted effort.

Why? Because most of us are not making serious money, if we’re making anything at all, from our fee-based lines of business (LOBs). What do I base this on? My firm has been measuring the profitability of LOBs and products since our inception. The average profitability of fee-based products was -10% during the first quarter of 2003, and is –7% during the first quarter of 2012. Are there exceptions? Yes. But on the whole, we have laid a giant egg.

This sad truth reared its head in profit improvement engagements that I worked on. Banks that have meaningful fee based LOBs typically dropped little to the bottom line. We recommend changes to not only get profits to where they should be, as defined by RMA’s common sized income statement (see table for Insurance Agencies), but also to absorb some overhead/support costs from the bank.

I like using RMA numbers because 1) bankers use these statistics to evaluate borrowers by industry, and 2) they are an amalgamation of profit performance of largely private companies by NAICS code. Sure, I could use publicly traded companies. But we have to be cautious comparing a community financial institution’s brokerage operation to Charles Schwab.

But publicly traded companies can be instructive. They typically operate independently, containing HR, IT, and Marketing Departments. These departments are not usually found in community FIs brokerage arms. That is why it is important to measure these units’ profitability with an overhead/support allocation. They rely on HR, IT, etc. from the bank. They should pay for it.

I am not against fee-based LOBs. In fact, managing finances, employee benefits, and risk is becoming increasingly complex for individuals and businesses… i.e. our customers. Developing expertise can clearly be consistent with your FIs strategy.

But they must be developed and managed to deliver meaningful profits to the bottom line. Succeeding will increase the amount of business you do with existing customers, make them stickier, and your FI more valuable to them. It will also increase your profits, reduce dependence on the spread, and reduce the relative size of your big three balance sheet risks… credit, interest rate, and liquidity.

Increase profits, make customers stickier, and decrease risk. Worth it? I would say so.

How about you?

~ Jeff

Saturday, September 15, 2012

Customer Profitabilty in Banking: Do you do it?

According to an ABA survey (see table), I doubt it.

I am speaking at the upcoming ABA Marketing Conference next week. Well, maybe not as much speaking as appearing. Mary Beth Sullivan and I are appearing as guests of Susquehanna Bank's Susan Bergen, in an Oprah like talk show format. I suggested Saturday Night Live's Point-Counterpoint format, but it was rejected. To appease my objection to appearing on Oprah, they orchestrated my entrance to a Pitbull song. I did not know who Pitbull was.

Our discussion will revolve around an ABA survey done this summer regarding actions banks have taken, or intend to take, to improve profitability. One question that didn't make the cut in the interest of time, was the one represented in this post's table: Does everyone in management know profitable versus unprofitable customers the bank serves today?


If you were in the corporate headquarters of McDonald's, you would be alarmed at the results. If you are in banking... not so much alarmed as happy that so many others remain as in the dark as you. I think lack of knowledge of profitable customers comes from three things:

1. Getting such a number requires investment in resources your FI currently does not have:
2. The regulators don't require the information; and
3. Even if you had the information, what would you do about it anyway?

All are related. FIs earn money on the spread. In order to create spread, FIs focus on creating a basket of the highest yielding assets within risk parameters, while funding them with a basket of the lowest costing funding. Why do you need some fancy profitability information to tell you that?

Problem: Various assets and liabilities take differing amount of operating expenses to accumulate. Also, based on risk, different assets and liabilities require different equity allocations. If your attitude is that the "incremental" cost of chasing this business or that is minimal, you may very well be mis-allocating your precious resources to low profit customers.

For example, we have a client that served the bar/restaurant business in a college town. These establishments brought decent balances to the bank. The problem: we found employees that spent half their day sorting through the bag-fulls of cash delivered every day. Could the bank allocate that operating expense to a campaign to acquire and serve higher profit customers? Without determining the profitability of those customers, we would never know about the opportunity lost.

I think it's time to change the paradigm from acquiring the highest yielding assets and the lowest costing liabilities based solely on interest earned or cost of funds. We should instead focus on acquiring and serving baskets of the highest profit customers. Doing so will efficiently allocate resources, improve our profitability, and enhance our FIs value.

~ Jeff

Saturday, July 14, 2012

Mortgage Banking: How profitable should it be?

I recently spoke to an old friend that is a bank equity research analyst and asked him how his coverage universe was doing with second quarter earnings. He said his "mortgage banks did great". Meaning that those that specialized in originating and selling or putting residential mortgages on their books had a great quarter due to the strength of originations.

Occasionally I get asked how much a mortgage banking unit should make. This is a tough question because there are various models. One where all loans are brokered and closed in the funding bank's name (mortgage brokers). Another model is where the bank funds the loans at closing and holds them for a brief period until they are packaged and sold (mortgage banking). The opposite extreme is where the financial institution books and holds the loan until maturity or pre-payment. This model is typically followed by some thrifts and credit unions.

What has proven the least profitable model of late is the mortgage brokering or holding mortgages briefly until sold. These models tend to rely on mortgage originators for volume, versus using traditional bankers such as branch managers or consumer lenders. Mortgage originators are notorious for demanding a significant slice of the revenue pie of the mortgage banking unit. This puts pressure on profitability.

I took a look at banks within my firm's profitability universe to look for models that relied heavily on originations then quick sales. My criteria was to ensure that over 50% of the unit's revenues were from fees on sold loans. It was true that just under half of the revenues of those that I reviewed were from the spread. But I wanted to get a granular look at how much a mortgage unit "should" make. The results are in the accompanying table.

There you have it. If your financial institution has a mortgage banking unit, it seems reasonable to me that your leadership should require profits of 25% of revenue. In efficiency ratio parlance, that is a 75% efficiency ratio. Not exactly knocking the cover off of the ball.

But I have found that many mortgage origination shops subscribe to what one banker described to me as the "five cookies" approach. If there are five cookies on the plate, is it fair that one party should take four and a half and leave the crumbs for the other party? Especially since the crumb-keeper must bear most of the risk.

Why be in a business that isn't improving your bottom line? It's a fair question.

~ Jeff

Tuesday, May 08, 2012

Risk Adjusted Return on Capital (RAROC) for Financial Institutions

How do you measure the profitability of lines of business, products, or customers? The simplest form is in dollars. But does that measure the profits against the investment required to generate those profits? For example, the riskiest banking products most likely deliver the greatest dollar profits, all other things being equal. At least until the risk comes to roost.

Another means to measure profits is the ratio of profits to the size of the portfolio being measured. In banking, we call it the Return on Assets (ROA). For example, a $500 million commercial loan portfolio will have a greater dollar profit than a $100 million consumer loan portfolio, all things being equal. But the ROA of the consumer loan portfolio could be greater. But ROA does not measure the risk of what is being measured, just the relative profit contribution regardless of size.

Banking is a risk business, and has many internal and external factors that impact the amount of risk per activity. This is one reason that financial institutions are getting serious about viewing risk across the entire franchise instead of in the organizational silos where they most exist. See my post on Enterprise Wide Risk Management on this subject here.

But through it all, risk requires capital. Look at the capital needed through the recent recessionary period for credit losses provided by either private investors or the US Treasury. Regulators assign risk weightings as a proxy for how much capital is needed based on the perceived risk of the asset. For example, a security in the investment portfolio may be 20% risk weighted, versus a loan that is 100% risk weighted. The total risk based capital ratio required by regulators to maintain "well capitalized" status formally remains 10%. So $100 million of 20% risk-weighted bonds requires $2 million of capital ($100 x 20% x 10%) versus $100 million of 100% risk-weighted loans requiring $10 million of capital.

If the amount of capital needed for a line of business, a product, or a customer varies based on risk, then it makes sense to measure the profitability of what is measured based on capital required. In industry parlance, we call that Risk Adjusted Return on Capital, or RAROC.

Financial institutions should assess on their own the amount of capital needed per product based on past experience, perceived risk, and potential loss. The table below shows how capital is allocated to each loan category based on a limited risk spectrum (credit, interest rate, and liquidity). Although for loans, these are probably the greatest risks, the financial institution may quantify other risks, such as operational (could it lose money due to fraud, hacking, etc.) or pricing (does the value of the asset fluctuate in the market, causing volatility and therefore risk).

I perform such an analysis for an ABA School of Bank Marketing Management course that I teach every May.  For my efforts I have been criticized that the topic was too complicated and I should remove it. But the course is on product profitability. How should I measure the relative profitability of business checking versus a home equity loan? Risk and the capital to support that risk should be the denominator in that equation. Agree? I say the topic stays. I'll take my lumps in the course evaluations.

What does your FI use as the profitability denominator?

~ Jeff